CINCINNATI -- Angela Staverman knows how stressful it can be to hunt for a home in a hot neighborhood. She and her husband, Kevin, made four offers before a seller said yes in Villa Hills.
"We didn't have the luxury of thinking about it or sleeping on it overnight," she said. "Most of the houses would have been gone if we would have waited."
Villa Hills ranked 10th on WCPO's list of the hottest Tri-State neighborhoods for home sales. The Stavermans made offers but were rejected in Fort Mitchell, which was the only Northern Kentucky neighborhood that made the Top 9.
Even in these neighborhoods, the Stavermans are proof that dream deals can be struck for those with patience and persistence.
"It's hard," Kevin Staverman said. "We've had to be pretty much on call any time a house goes on the market."
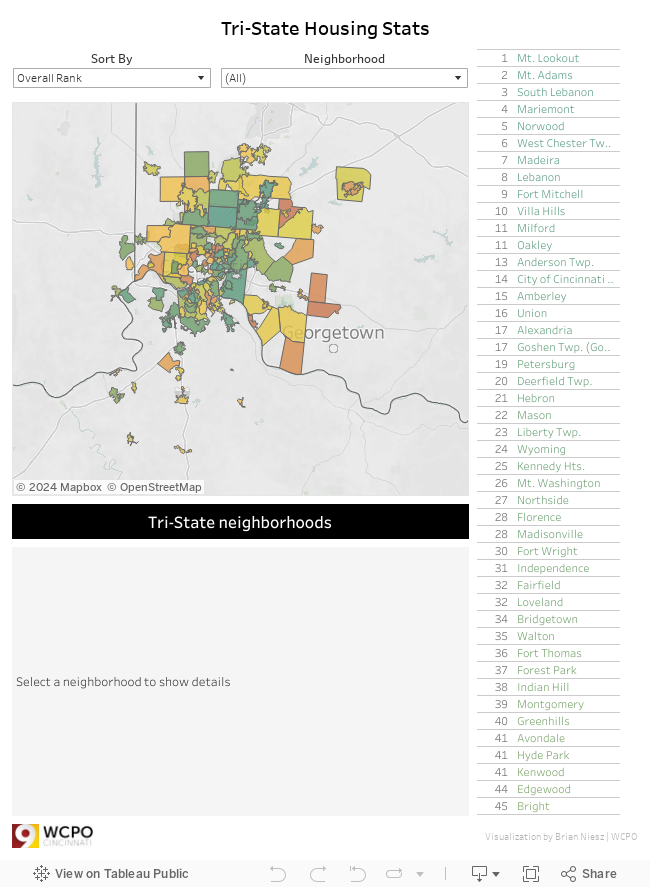
With those lessons in mind, WCPO invites you to dig into the sales data for your favorite neighborhood. What part of town had the most sales this year? Where are prices rising the fastest? How many homes are still available in your neck of the woods? Where do listings draw the most eyeballs online? The numbers could help you decide whether to put your home on the market and how hard it will be to find that next abode.
How we did it
WCPO collected Multiple Listing Service data from the Cincinnati Board of Realtors and the Northern Kentucky Association of Realtors. Additional data came from Zillow.com and Robinson Sotheby International Realtors. That allowed neighborhood comparisons in nine categories that measure how many homes are selling at what price and how much demand and supply exists in different parts of town.
Here are the nine categories:
- 2018 Completed Sales tracks the number of single-family homes sold between January and April of this year.
- 2018 Average Price is what buyers paid on average for all homes sold in the first four months of this year.
- Sales Growth is the percentage difference between the number of homes sold in the first four months of 2018 compared to the same period in 2017.
- Average Price Hike is the percentage difference in the average price of homes sold from January to April in each of the last two years.
- Page Views represents the number of page views per listing on Zillow.com since the beginning of 2018. Data was provided for 56 different neighborhoods and municipalities.
- Declining Inventory is another Zillow measurement that shows the year-over-year difference in "for-sale inventory" for 57 different neighborhoods as of April 18.
- Excess Inventory (Jan-Apr) compares Zillow's estimate of the number of homes for sale on April 18 to the average number of homes sold each month from January to April. The lower the number, the more difficult it will be to find available homes in this neighborhood.
- Excess Inventory (May) comes from Robinson Sotheby International Realty. It compares the number of homes available in May to the available inventory in the same period. Again, a lower number means demand is stronger than supply.
- Pricing Strength compares the average sale price of homes sold in May to the average list price in a particular neighborhood. Numbers above 100 percent indicate this is a tough place for bargain hunters.
Here are the Top 9
No. 9: Fort Mitchell had three homes available for every home sold in May, when its average sale price was about 22 percent below the average list price. Buyers claimed 26 properties there from January to April, up 18 percent from last year. The average sale price rose 12 percent in the same period to $267,500.
Huff Realty Principal Broker Susan Huff said Fort Mitchell never lost housing value in the 2008 recession. Now, young families are now replacing the neighborhood's empty nesters, drawn by the highly ranked Beechwood Independent School District.
"It's an amazing market," Huff said. "It's convenient to everything."
No. 8: Lebanon home sales accelerated in May, with 33 buyers shelling out an average of $222,570 per home. That's a 5 percent increase from the four-month average of 21 sales before May and an 8 percent increase in the average sale price. Inventory is shrinking, with less than one home available for every home sold in May.

Marc Cameron
"Many of the new listings in March and April went pending very quickly," said Marc Cameron, vice president and sales manager for Sibcy Cline Realty's Northeast office. "Many of the homes that sold this spring were higher priced homes."
No. 7: Madeira ranked 10th in the region with an average sale price of $385,406 between January and April. That's up 18 percent from one year ago, but the market doesn't appear to be overheating. For every home sold in May, 1.6 were still available, and the average sale price in May was only 67 percent of the $564,674 average list price.
"Multiple offers have occurred many times, particularly at prices under $275,000 in Madeira," said Judy Recker, executive sales vice president for Sibcy Cline. "Many of the buyers are millennials with young families."
No. 6: West Chester ranked second in the region with 197 homes sold between January and April, up 3.7 percent from a year ago. Another 107 sold in May. Inventory is struggling to keep up, but the average sale price in May was only 51 percent of the average list price of $442,793.

Amy Markowski
"The market continues to show strength," said Amy Markowski of Keller Williams Realty. "My team has 18 current pendng transactions. Ten of those are just from the beginning of June."
No. 5: Norwood ranked sixth in the region in pricing strength with an average sale price of $152,660 in May -- was 102 percent higher than its average list price. Buyers claimed 100 Norwood homes from January to April, up 39 percent from one year ago. Inventory is shrinking, with only 33 homes available in April and 25 in May.
No. 4: Mariemont had the region's third highest average sale price from January to April, when 53 homes sold for an average of $539,675. That's 59 percent higher than last year's average sale price. The market cooled a bit in May with 9 homes selling for an average of $452,766 and 3.1 homes available for every property that sold.
No. 3: South Lebanon ranked among the region's top 30 in six different categories, including declining inventory. Zillow reported 19 homes available on April 18, down 36.7 percent from a year ago. It also produced a 79 percent increase in completed sales in the first four months of 2018, as the average sale price increased 26.5 percent to $217,672.
"The big news in South Lebanon is new home construction," said Sibcy Cline's Marc Cameron. New projects by home builders Drees, Fischer and Ryan are "driving the average sale price and the number of sales."
No. 2: Mt. Adams from January to April at an average price of $631,173. That's a 28 percent increase in average sale price. The trend continued in May, with three homes fetching an average of $654,723. Mt Adams ranked fourth in the region in page views per listing on Zillow this year.
"Mt. Adams suffered badly until very recently," said Lee Robinson, owner of Robinson Sotheby's International Realty in Hyde Park. "It used to be the safe, urban area before the new restaurants and parks brought people to Over-the-Rhine. But the pendulum has now swung back."
No. 1: Mt. Lookout is also a market leader in pricing and page views. Zillow reports 2,651 page views per listing in this east-side neighborhood, third-highest in the region. Mt. Lookout ranked fifth with an average sale price of $503,089 from January to April, up 32 percent from last year. In May, the average sale price dipped to $447,473. But that's still 77 percent of the average list price, making Mt. Lookout one of the region's 20 best neighborhoods in pricing strength.
"Mt. Lookout is hot," said Sibcy Cline agent Julie Back. "It's really the charm, the walkability, the safety factor and closeness to everything."

Mt. Lookout Square
Here's the future outlook
Did prices surge in Mt. Lookout because developers are demolishing older homes to replace them with new homes on subdivided lots? It’s a controversial topic, one that led Cincinnati City Council to place temporary zoning controls on the practice. But the numbers don’t seem to indicate a correlation between residential teardowns and hot markets.
For one thing, a city report on the issue said Mt. Lookout had nine demolitions and four lot subdivisions since the start of 2017. That’s less than 10 percent of the total sales volume in Mt. Lookout since 2017. Hyde Park had 22 demolitions and four lot subdivisions in the same period but it ranked 41st on WCPO’s list of the hottest neighborhoods.
In the meantime, a new analysis from Zillow provides more evidence that Mt. Lookout is the region’s hottest market. It ranked first among Cincinnati neighborhoods in a comparison of home-sale profits in 2017. Mt. Lookout residents who sold their homes last year scored a median gain $71,250 on the sale, Zillow said this week. That’s three times better than the rest of the region, where homes sold for $22,500 more than sellers paid for them years ago, a gain of 15 percent.
The median home-sale gain nationally was $39,000, or 21 percent.
Cincinnati's tight inventory will continue to drive home prices higher in 2018, said Sarah Mikhitarian, a senior economist for Zillow. Although Cincinnati has tighter inventory than the rest of the country, median home values are up only 5 percent to $157,000 so far this year, compared to a 9 percent increase to $215,000 across the U.S.
"Nationwide, we're seeing the fastest appreciation in 12 years," she added.
Even in Cincinnati's hottest neighborhoods, the numbers indicate more sales growth is possible.
In Mt. Lookout, for example, there were 4.2 active listings in May for every home sold, and the average sale price was about 23 percent less than the average list price of homes still available, indicating there is still some room for hagglers.

Susan Huff
"In the last two weeks, I feel like we're seeing more listings come on the market -- finally," said Susan Huff. "So I think that's a good sign."
Other agents agree that the market is making some corrections, with fewer bidding wars in recent weeks.
Some "buyers in multiple officers are having remorse," said Sandra Burkhart Williams, a Huff Realty sales associate. "During inspections, they're trying to get improvements done because they feel like they've overpaid."
Some homes are coming back on the market because bank appraisers don't agree with the purchase price, said Sibcy Cline's Marc Cameron.
"Bottom line: A buyer or a seller should consult a professional realtor who watches the market daily, knows how to search and locate the best opportunities, can introduce buyers to builders an assist in the entire contract to close process," he said.