CINCINNATI — Just how safe is it to drive through Cincinnati?
It’s a critical question for almost all of us, and it's no secret there's a lot contributing to headaches on Cincinnati roads.
Ongoing construction and traffic pattern changes on the Interstate 75 corridor as well as renewed vigor toward city street repairs have made space on roads seem at a premium, no matter what the route.
But where are the most crashes occurring?
WCPO crunched data from four different agencies to compile a portrait of the most crash-prone intersections and stretches of road across Cincinnati.
Where Are Drivers Crashing?
It will come as a surprise to roughly no one that the interstates measured the most crashes between 2012 and 2014, according to the Ohio Department of Transportation, and it might come as even less a surprise that the top two crash hot spots are on Interstate 75, near Martin Luther King Jr. Drive.
I-75 between Marshall and MLK/Hopple
Interstate 75 between Marshall and MLK/Hopple
235 - crashes 2012-2014
77 - average crashes per year
I-75 between Marshall and MLK/Hopple
Interstate 75 between MLK/Hopple and Monmouth
215 - crashes 2012-2014
72 - average crashes per year
I-75 between Marshall and MLK/Hopple
Interstate 71 between Joe Nuxhall Way and Fifth St. (Fort Washington Way)
213 - crashes 2012-2014
71 - average crashes per year
Click images to enlarge or see viewer above, if on mobile.
As far as city streets go, Reading Road, Mitchell Avenue, Paddock Road, and Central Parkway top the list for crash hotspots. Specifically, these intersections saw more collisions in 2014 than any others, according to Cincinnati Police Department data:
Reading Rd./I-275
Reading Road at Interstate 275
17 crashes in 2014
W. Mitchell Ave./I-75
W. Mitchell Avenue at Interstate 75
17 crashes in 2014
Reading Rd./Eden Park/Dorchester
Reading Road at Eden Park & Dorchester
13 crashes in 2014
Paddock Rd./Seymour Ave./I-75
Paddock Road at Seymour Avenue & Interstate 75
13 crashes in 2014
Central Pkwy/Harrison
Central Parkway at the Western Hills Viaduct
11 crashes in 2014
While not a city street, Columbia Parkway between Downtown and Mount Adams — which is policed by CPD — saw 24 crashes in 2014 alone, according to city data.
For those who don't like mental math, that means, on average, a crash every two weeks.
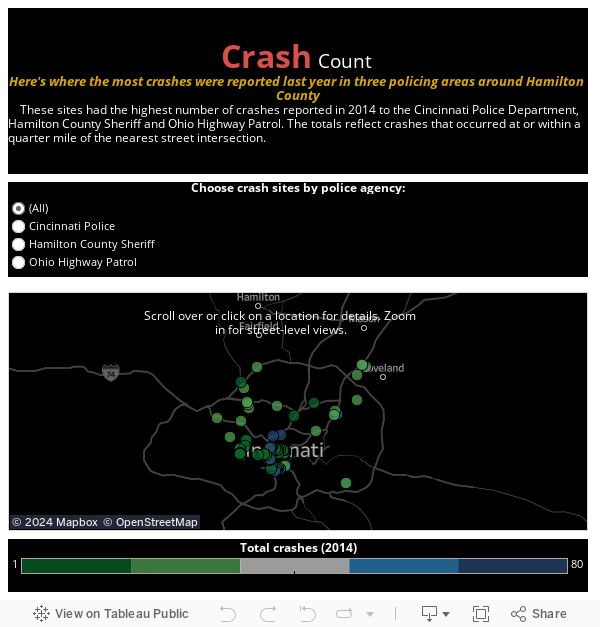
Throughout Hamilton County, these crash-prone spots emerge. Crash data was compiled from the Ohio State Police, Hamilton County Sheriff's Office, and the Cincinnati Police Department. To use the map below, select all agencies or a specific agency to view crash-prone spots in a specific jurisdiction. Use the +/- buttons to zoom, and hover over or tap a spot for more details:
How Serious Are the Crashes?
According to the Ohio State Highway Patrol, crashes might be on an upswing in our area, but fatal crashes are a different story.
OSP District 8, which covers southwest Ohio, shows an overall decrease, at 6 fewer fatal crashes year-to-date than this time last year, district-wide.
Courtesy OSP.
But, more locally, the overall decrease doesn’t hold true.
In Hamilton County alone, there have been 35 fatal crashes so far in 2015, surpassing the annual total just two years ago (32 in 2013), and we’re currently outpacing last year by five fatal crashes.
Warren County has already matched last year’s total, outpacing 2014 by three fatal crashes to-date.
Fatalities on Kentucky roads have increased state-wide, as well. So far in 2015, 514 drivers or passengers have died on the road, well above 2014's total of 471 year-to-date.
Campbell, Kenton and Boone counties sit in the middle as far the number of fatalities so far this year:
2015 Yearly Fatality Information (Kentucky State Police)
'Everything Is a Distraction'
Ohio State Troopers told WCPO a combination of three factors makes the hotspots above particularly crash-prone: construction, changing traffic patterns, and plenty of stop-and-go.
OSP Sgt. Matthew Beccaccio also sees drivers getting more aggressive and leaving less room for error.
“Most of the crashes that I think we handle statewide have a lot to do with following too close,” Beccaccio said. “(That with) driver inattention calculated also with speed, people using too much speed.”
OSP data showed over 3,000 drivers or passengers in southwest Ohio were hurt last year because a driver followed too closely.
Beccaccio also said he has felt the local increase in fatal crashes.
“We’re way up (on fatals), and I think we can credit a lot of that to drivers just not budgeting for their time, pushing their limits, not doing little things like double-checking their mirrors…not driving vehicles that are roadworthy,” he said.
Construction zones are particularly problematic. “You see an absolute disregard for the safety of the people working the construction zone.” Despite the signs, Beccaccio said, “people are not slowing down.
A lot of the time, though, it just boils down to inattention and distraction.
“Everything is a distraction,” Beccaccio said. “The business signs, the orange barrels, the flashing lights, the bumps in the roadway.”
For Beccaccio and other troopers like him, the list of distractions drivers have to deal with has become seemingly endless.
“Most of the time, [the driver is] not really paying attention that closely,” he added. “I usually ask them, ‘Well, what did the car you were following or the one in front of it look like?’”
Ultimately, troopers say defensive driving is critical to safe driving — and that doesn’t mean simply driving slower, but instead driving smarter and more attentively.
“Reading the roadway, watching the cars around you, not only the cars in front of you but next to you, behind you, coming the other direction,” Beccaccio said, is the key to staying safe behind the wheel.