A heaping helping of IPO stock grants powered the pay plans of two Cincinnati executives who got some of the region’s biggest raises in 2015.
Milacron Inc. awarded stock options worth more than $5.6 million to its top executives when it went public last June. The options give CEO Thomas Goeke the right to buy up to 324,922 shares in the next 10 years at the IPO price of $20 per share. Milacron President Ronald Krisanda was awarded options to acquire 122,796 shares on the same terms.
RELATED: For more on this story, watch 9 On Your Side at 6 p.m. Thursday.
Milacron’s shares have dipped as low as $11.56 in its first year as a new public company, recovering in recent months to close Tuesday at $16.02. That means the options are currently worthless. But, the amounts disclosed in pay plans are present-value estimates of what they’re likely to be worth over time.
Milacron told shareholders that Goeke’s options grant was worth $3.1 milion, which was 57 percent of his entire compensation package for 2015. Goeke ranked second among Cincinnati executives with a 316 percent raise. Krisanda ranked eighth with a 97 percent raise. His options grant was worth $1.1 million and represented 60 percent of his total pay.
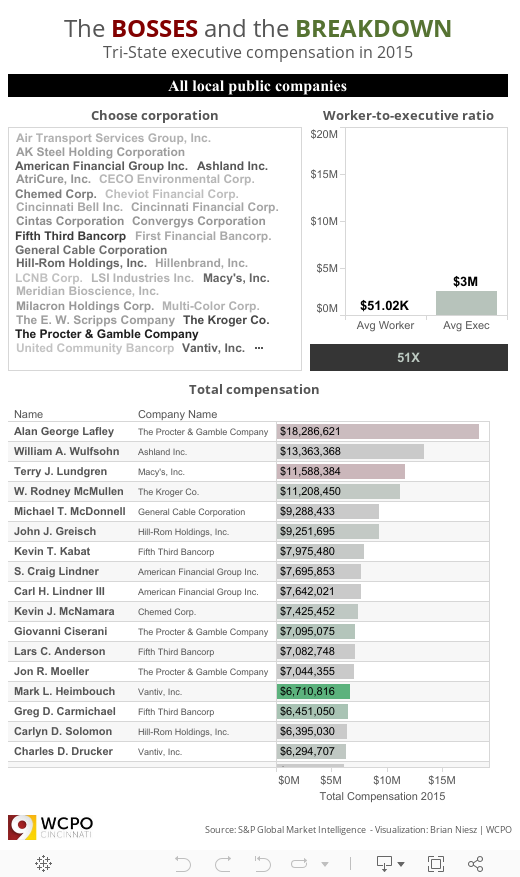
This is part of WCPO’s annual analysis of executive pay. This year’s searchable database includes details on cash and stock-based compensation totaling $390 million for 151 executives from 29 companies.
#10 Thomas J. Linneman
Former Chief Executive Officer, President, Executive Director, Chief Executive Officer of Cheviot Savings Bank, President of Cheviot Savings Bank and Director of Cheviot Savings Bank, Cheviot Financial Corp.

Raise:
84.88%
Total 2015 Compensation:
$813,612
Total Shareholder Return:
10.71%
#9 Sharon E. Birkett
Chief Financial Officer, Vice President of Finance and Secretary, Multi-Color Corp.

Raise:
85.73%
Total 2015 Compensation:
$775,812
Total Shareholder Return:
98.95%
#8 Ronald M. Krisanda
President and Chief Operating Officer, Milacron Holdings Corp.

Raise:
96.94%
Total 2015 Compensation:
$1,834,632
Total Shareholder Return:
NA%
#7 Thomas E. Simpson
Chief Technology Officer and Senior Vice President, Cincinnati Bell Inc.

Raise:
107.96%
Total 2015 Compensation:
$819,303
Total Shareholder Return:
12.85%
#6 Nigel A. Vinecombe
Executive Chairman, Multi-Color Corp.

Raise:
122.26%
Total 2015 Compensation:
$1,734,156
Total Shareholder Return:
98.95%
#5 Jeffrey Lang
Chief Executive Officer, President and Director, CECO Environmental Corp.

Raise:
146.44%
Total 2015 Compensation:
$2,294,633
Total Shareholder Return:
-49.14%
#4 Royal Cole III
Group President of Merchant & Financial Institution Services, Vantiv, Inc.

Raise:
179.68%
Total 2015 Compensation:
$4,109,722
Total Shareholder Return:
39.80%
#3 Mark L. Heimbouch
Chief Operating Officer and Director, Vantiv, Inc.

Raise:
233.19%
Total 2015 Compensation:
$6,710,816
Total Shareholder Return:
39.80%
#2 Thomas J. Goeke
Chief Executive Officer, Director and President of Milacron Holdings Corp.

Raise:
316.20%
Total 2015 Compensation:
$5,401,844
Total Shareholder Return:
NA%
#1 Marjorie Mary Connelly
Chief Operating Officer, Convergys Corporation

Raise:
439.37%
Total 2015 Compensation:
$2,309,304
Total Shareholder Return:
23.79%
METHODOLOGY
WCPO obtained compensation data from S&P Global Market Intelligence, which pulled it from annual proxy statements companies filed with the Securities and Exchange Commission. Specifically, compensation data from the "summary compensation table" in each company's proxy document was analyzed. The pay category Changes in Pension Value was excluded from tabulations, because it is an actuarial estimate and does not reflect actual gains and losses. Some executives benefit from above-market interest rates in their pension plans. Those benefits, when disclosed, are counted as cash-based pay.
That data was combined with average worker salary data from the Bureau of Labor Statistics report: May 2015 National Industry Specific Occupational Employment and Wage Estimates.
North American Industry Classification System (NAICS) data was also used to most closely match each company to determine average industry worker salary, although many companies actually compete in multiple categories. NAICS data is the standard used by federal agencies to classify businesses in order to collect, analyze and publish statistics tied to the U.S. economy.
Performance data for each company was supplied by S&P Global Market Intelligence, which pulled total shareholder return estimates over one year and three years for the fiscal year in which that company operates.