


CINCINNATI -- A new tool launched this week is aimed at painting a clearer picture of when and where bus service is in the most demand across the Tri-State.
The Better Bus Coalition, a grassroots transit advocacy group, has developed an online, interactive map that provides route and navigation data throughout the Cincinnati Metro system. It also includes information about wheelchair accessibility, which stops are used the most and how many passengers each route usually carries each weekday.
"There's not a way really to easily see this kind of data," said Mark Samaan with the Better Bus Coalition. "Through this, people can actually see which stops are used and which are not."
Samaan is a numbers guy, volunteering for the coalition as a data analyst. His data-driven approach has led to multiple revelations about Cincinnati Metro service, including efficiency recommendations based on identifying the routes with the highest and lowest ridership.
I-TEAM: Facing budget woes, do Metro buses need re-routing?
The map is Samaan's way of visualizing the numbers.
"This is what it looks like. This is how many people are being moved. This is where people are being dropped off," he said.
Map users can enter an address and then locate the nearest route, marked with color-coded lines. Clicking the line reveals the name of the line or lines running along that road, the route number, and parts of town riders can access from that stop.

Top half: Map showing all Cincinnati Metro bus route corridors. Bottom half: Map displaying route information after user selects a road.
The sidebar also can display which stops see use by riders in wheelchairs, how many people board at each stop and how many passengers each route carries every year.
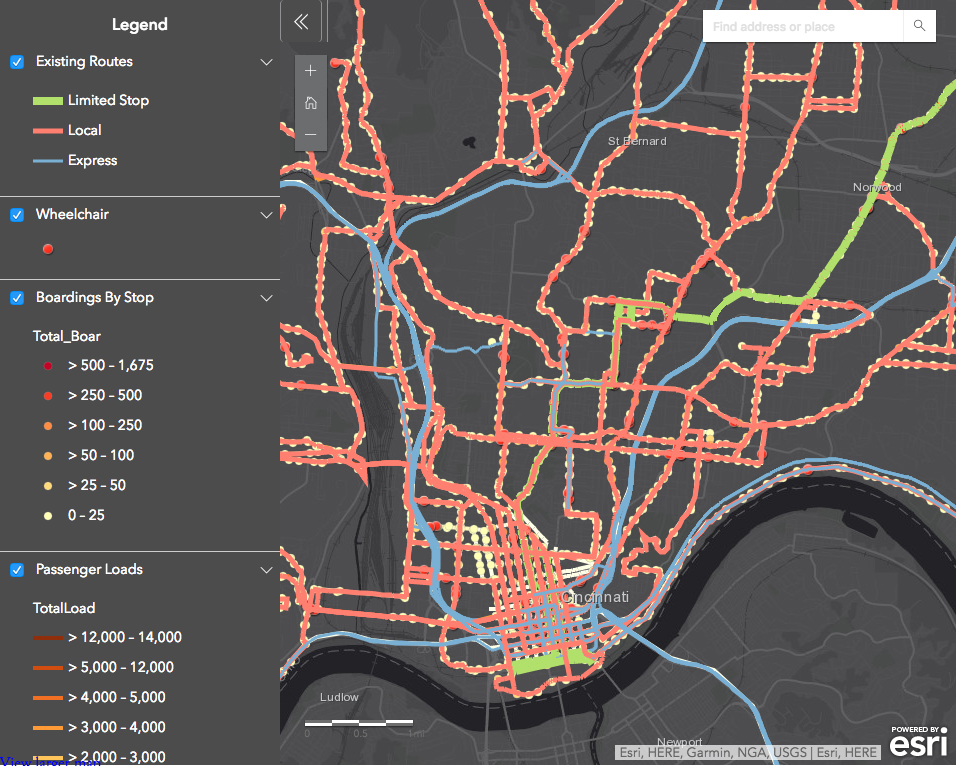
Users can add different filters to identify other information about the bus system. The map also zooms to provide more detail.
Users should still refer to Google Maps for a comprehensive map of bus stop locations and arrival times.
"This isn't so much about trip planning," Samaan said. "It's more about seeing what ridership looks like. Making this map, I've noticed more details. You'll see clusters of things, where there will be issues."
Samaan said all the data came from the Southwest Ohio Regional Transit Authority, which owns and operates the bus system.
"They compile ridership data every month, for every route and for each stop," he said. "It's all public record; anyone can see it."
The map is the latest in the coalition's efforts to promote enhanced bus service in the region. The group released its wishlist for Cincinnati Metro in November. The plan includes more routes, more frequent service and bus rapid transit options. That's a system that dedicates a lane of traffic to bus travel only along certain routes.
Those service upgrades would come from a new, three-quarter-cent sales tax in Hamilton County, a ballot measure likely to appear before voters in November. The Southwest Ohio Regional Transit Authority's board in June 2017 gave its staff authorization to take steps toward placing the measure on the ballot. The transit authority owns and operates Cincinnati Metro.
The board is set to decide early this year what sales tax rate they will pitch to voters.
SORTA staff unveiled their own plan for filling the bus system's looming $150 million gap in December. It also hinged on the implementation of a new sales tax, with options ranging from a half-cent to a full-cent levy.
The .7-percent option is where the system would see "real, substantial change," SORTA CEO and General Manager Dwight Ferrell told the board.
Mayor John Cranley has said he would support a half-cent sales tax increase in Hamilton County.
Samaan hopes online tools like his interactive map will help boost ridership by showing just how in-demand public transit is in Cincinnati.
"It breaks that myth that people don't use public transportation in Cincinnati, because you can go through and see," he said. "How many people are actually moved on each street, each day by bus."
According to SORTA data, Metro provided roughly 15 million trips in 2017 -- an annual count that has begun to slip slowly over the past five years.
Pat LaFleur reports on transportation and mobility for WCPO. Connect with him on Twitter (@pat_laFleur) and on Facebook.
